
Google Maps Reimagined
A conceptual collaboration project with Google Maps and SCADpro, Google Maps was reimagined for young urban users. Some concepts included in this conceptual design have developed and integrated into Google Maps.
What would Google Maps look like if it was designed from the ground-up specifically for mobile youth’s behaviors, needs and aspirations?
Gen Z are digital natives navigating their lives equally in the physical space and in their high social digitally curated one. Google Maps can be the bridge between worlds.


Gen Z's digital hierarchy of needs
Within Google Maps, Gen Z have a distinct hierarchy of needs starting with what brought them to the app: navigation. Gen Z's need for social connectivity and sharing bring them their second needs: connection. With both of these foundational needs met, Gen Z turn to digital wellness needs: memory, their desire to remember and be remembered; independence, their desire to self guided and taught; wellness, their desire to care for their mental health and the planet's wellbeing. Finally, Gen Z's need to be unique and adventurous points to their final need: spontaneity and experiencing the new.

Experience pillars
With these needs in mind, we developed our 6 key experience pillars to help us ideate and design.

Archetypes
Following extensive primary and secondary research, 4 archetypes were outlined from which personas were born. These archetypes captured our audience and helped us envision the application's features and feel.

What would Google Maps look like if it was designed from the ground-up specifically for mobile youth’s (target ages 18-24) behaviors, needs and aspirations?

Developed Feature List

Onboarding
Takes notes of the preferences and goals of its user in order to curate experiences that are tailored to the user’s personal desires.
When users open the app for the first time, they are prompted with a series of questions. This process can be skipped, but the idea is for Google Maps to learn more about the user so it can produce personalized content and accommodate their needs and interests.


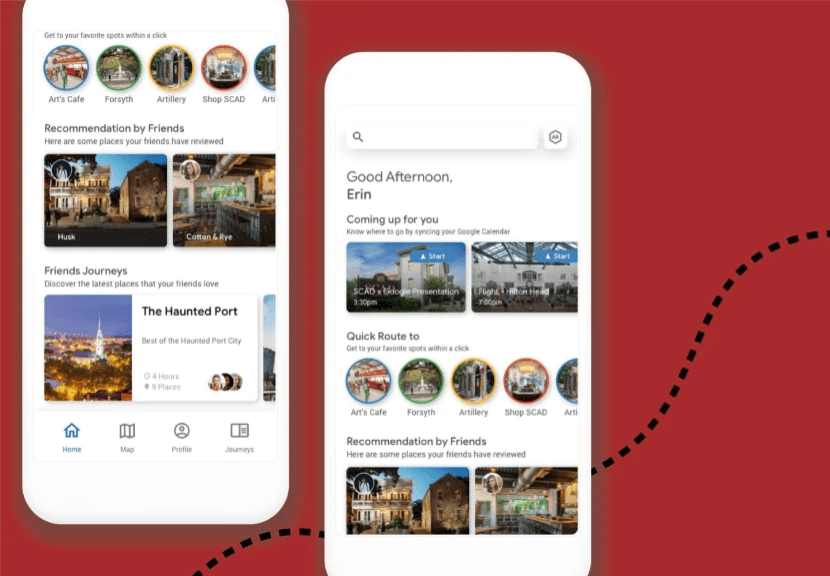
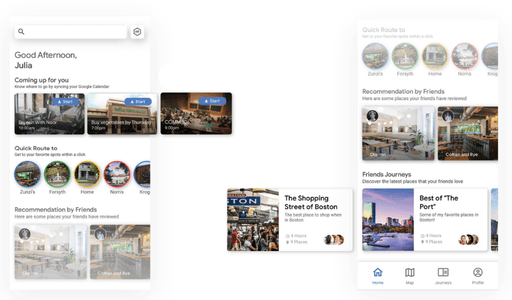
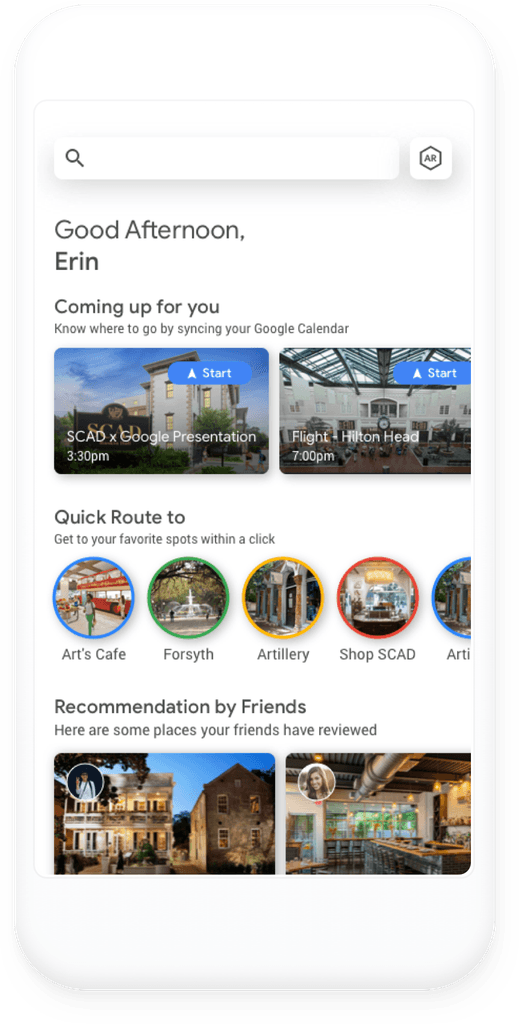
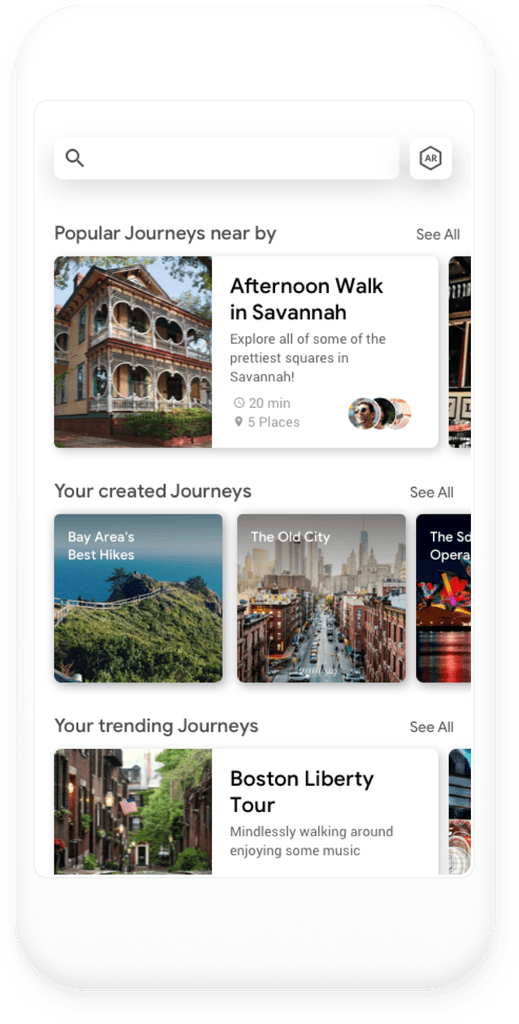
Home: Dashboard Reimagined
A quick overview of what the user has on their agenda for the day and a quick highlight of their memories and things their friends are doing. The user is able to go through every aspect of their daily plans. Fast access to destinations the user frequents is provided and there are reviews and recommendations from friends as well.

Navigation Bar
Our users are prompted to navigate through the bottom navigation bar, that consists of the following 4 categories:

Home- an adaptive feed that accommodates to user’s wants and needs throughout the day.
Maps- Place for people to discover locations, and places through searching and through AR view.
Journeys- A hub for created, saved, and published journeys
Profile- A personal page for users to access their editing settings, saved journeys, memories, and friends.

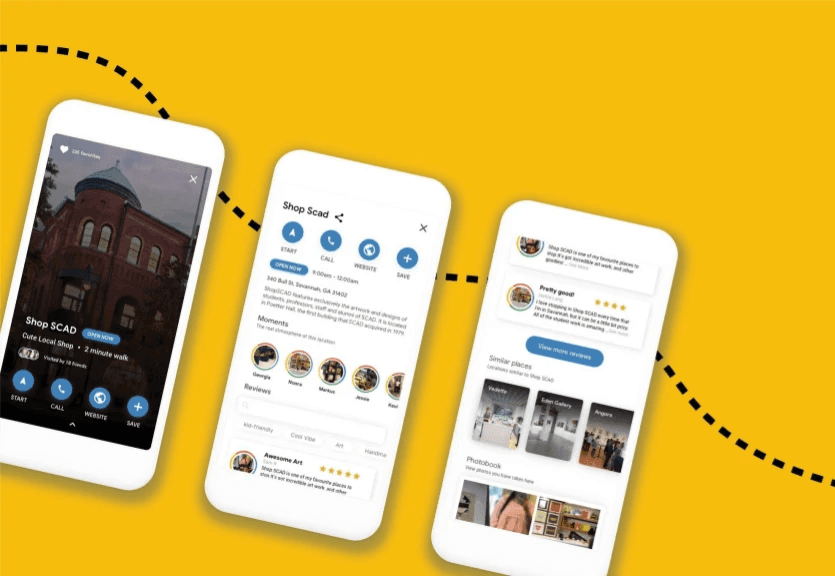
Search Results Reimagined
Search results arranges the most relevant information to each user in a convenient and efficient way which also enables exploration.
As a user searches for a place, the app responds with a quick result along with a view of friends who have visited, the distance from where the user is currently, and an option to begin navigation.


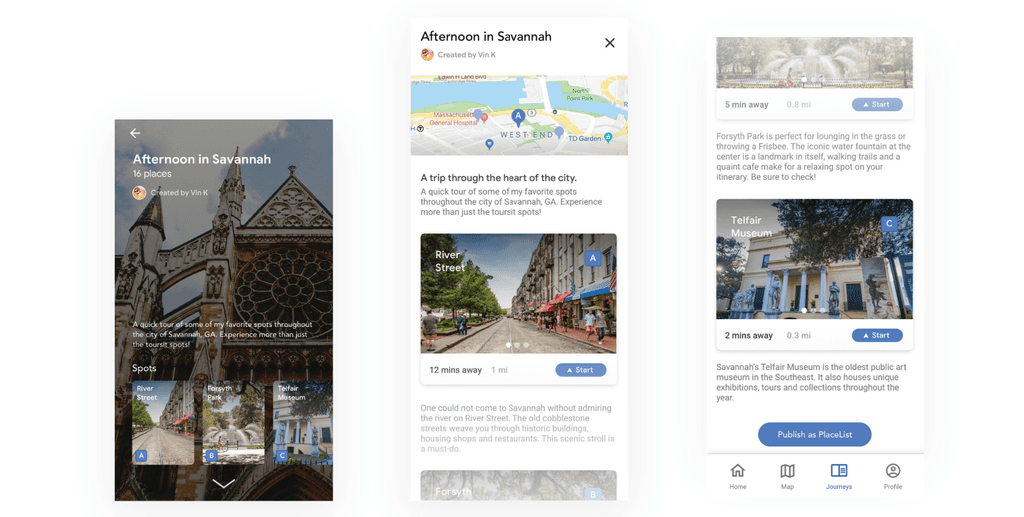
Place Details
Details for locations including reviews, friends’ activity at the location, and highlights of past experiences.


Journey
Journey itineraries can be created and customized with an easy to use interface.


Memories
Photos and information from Journeys are stored and organized together here. Memories can be converted into Journeys for the user to easily share an experience or relive it later.


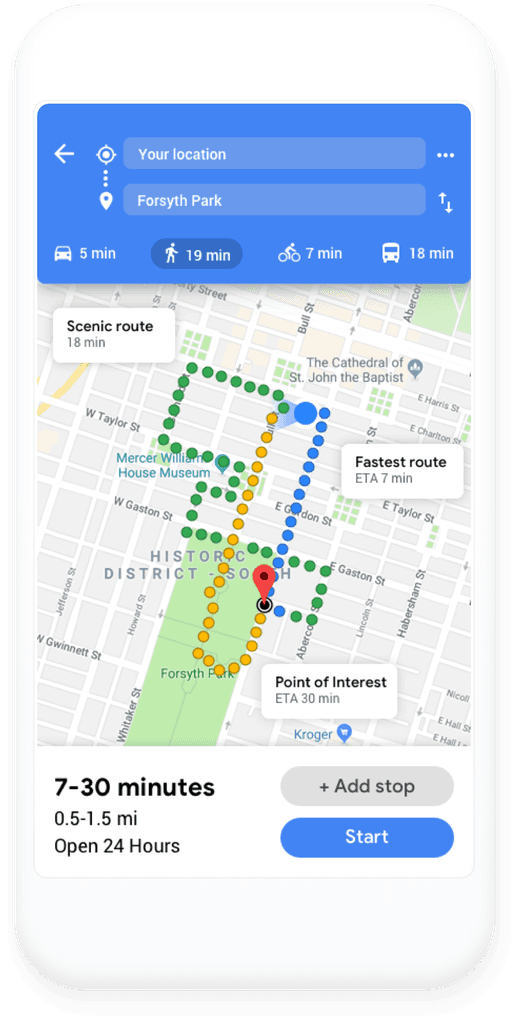
Alternate Routes
Providing other travel routes to help users further their growth and exploration based on their interests and needs.


Desire Compass
An Augmented Reality mode that helps users explore new spots and activities on the fly. The compass displays categorized places and events based on the user’s preferences. They can pan around a fixed location and search for possible activities in their area. The user can pan around to quickly gauge the suggestion. Different colored hazes denote the type of activity or place that is represented to instantly notify the user what type of experience it is.


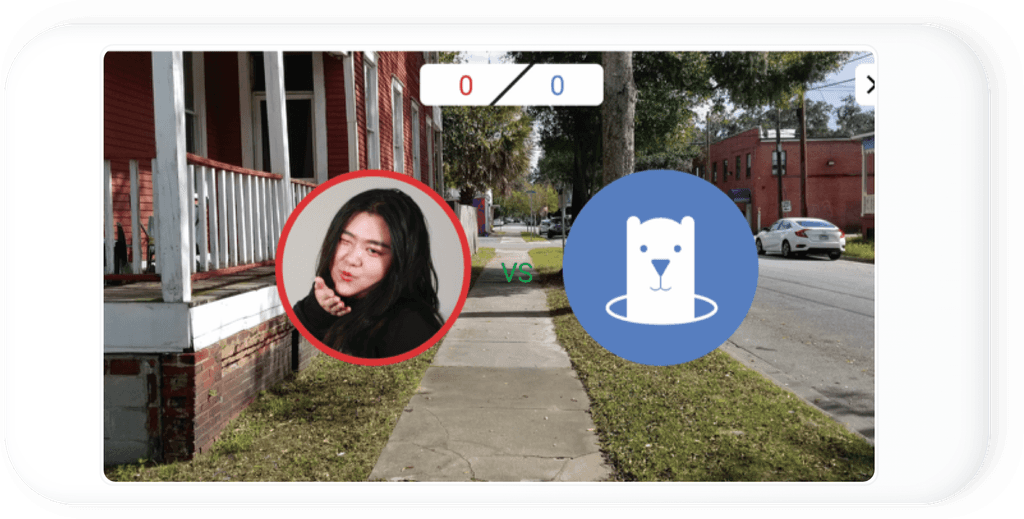
Gaming
A reimagined Google Maps offers users a way to explore and make connections during their travels.


Shareboard
A world of interesting and relevant posts created by other users share information about surrounding businesses and possible experiences in the area.


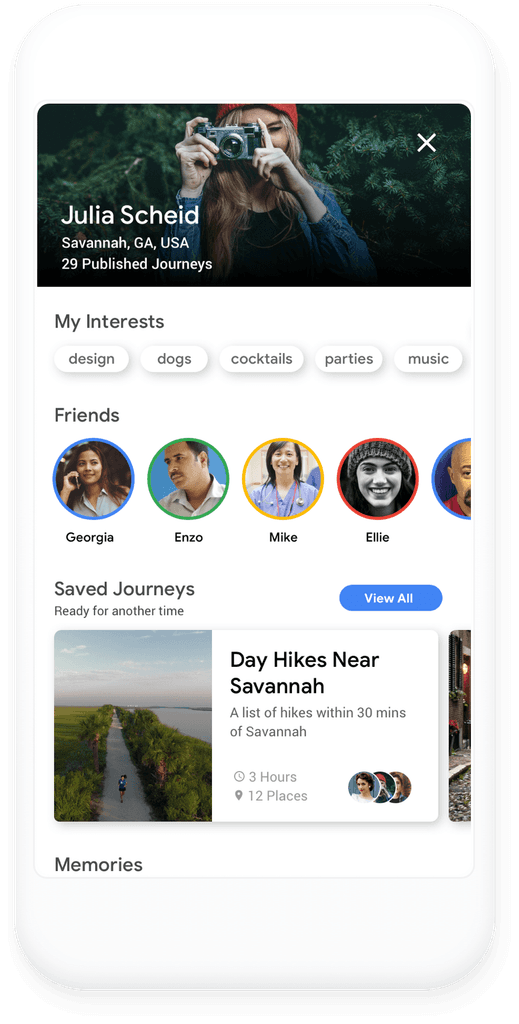
Profile
An organization of a user’s created content for convenience and quick access.


View the full process book
Want to learn more? Full process details are included in the book.


Research
We began the project with both primary and secondary research, interviewing over 120 people and ended up with over 900 data points.

Affinitization & Opportunities
Our team defined our insights after affinitization and then began to identify opportunities to prompt our ideas.


Ideation & Testing
Exercises and brainstorming sessions led us to concepts we eventually refined and prepared for user testing feedback.

Storytelling
Preparing our vision and presentation for key business executives and stakeholders.


